What happened to the Energy Market, during the heat wave?
Between Wednesday the 18th of November to Friday the 20th of November, parts of Australia experienced extreme heat, culminating in some areas seeing temperatures above 40°C on Friday afternoon.
Today’s temperatures, animated https://t.co/LXuoXjJ4Z3pic.twitter.com/YhqrJFk8fn
— Matt Liddy (@mattliddy) November 20, 2015
The chart below shows the daily maximum temperatures for the Bureau of Meteorology weather station at Sydney Observatory, which has been recording data since 1859, sorted from highest to lowest:
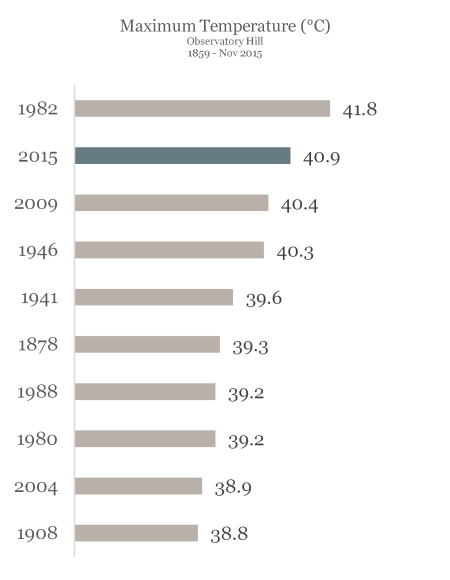
As you can see from the chart, 2015 has already recorded the second highest maximum on record, with the highest occurring in 1985.
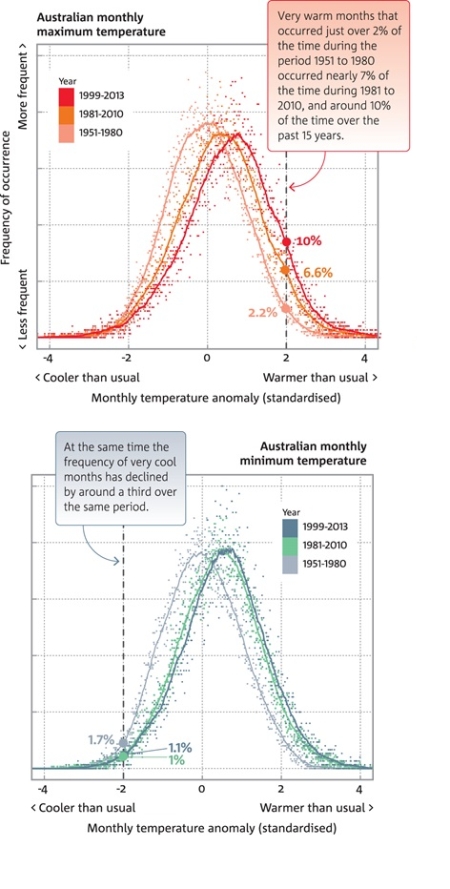
Though single events can never be reliably attributed to a single factor, one of the long-term outcomes of climate change is the increased prevalence of abnormal extreme heat in Australia, as explained by this chart:
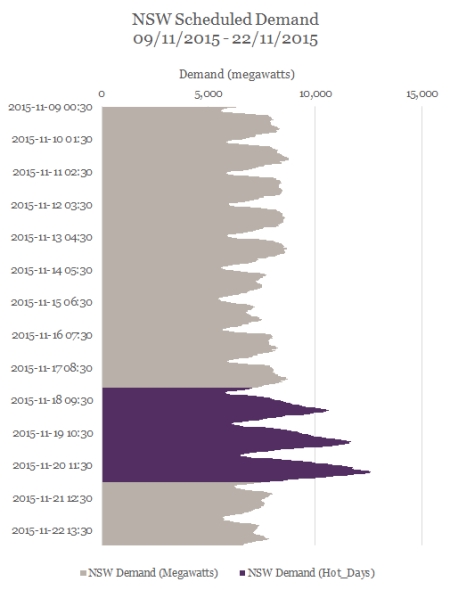
A connected phenomenon is the very large increase in electricity demand that occurs on hot days, due almost entirely to the usage of air-conditioners that cool residential and commercial buildings. You can see this comparative increase in demand in a chart of last week’s half-hour ‘scheduled’ demand levels:
It’s interesting to look at the mix of generation types in the National Electricity Market over that period. You can see very classic generation profiles for wind and solar over the three day period:
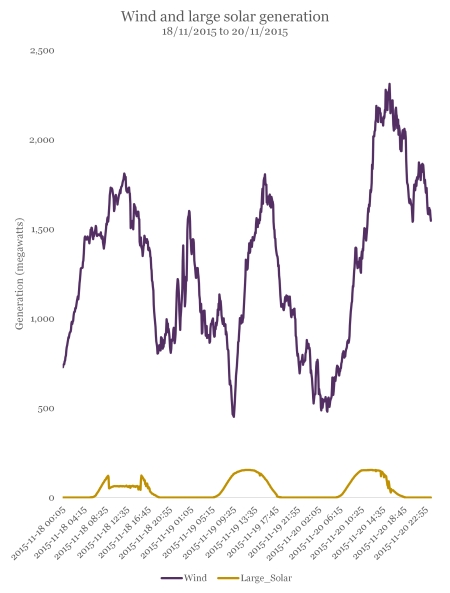
Note that rooftop solar PV isn’t counted as a generator in the data above – the solar refers only to the two AGL large-scale solar plants, both of which are in NSW.
There were no major periods of power loss during the time period, aside from several smaller outages in some suburbs. Several generators were limited by the market operator due to the impact of extreme heat on the transmission network, triggering ‘thermal constraints’.
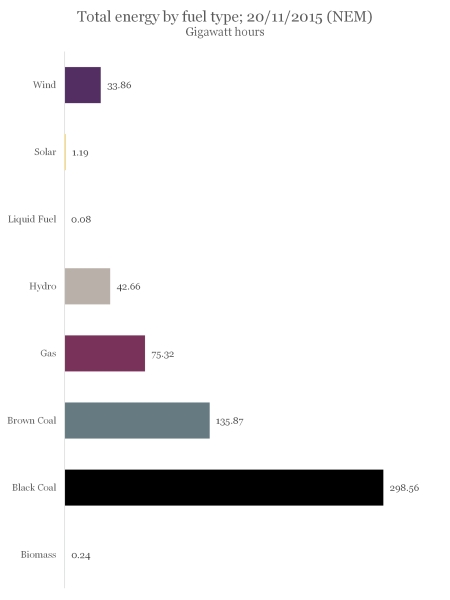
Over the course of Friday the 20th, renewable fuel types (large-scale solar, wind and hydro) met 13% of total electricity demand in the National Electricity Market. Compare the chart above to the total emissions per technology type over the day:
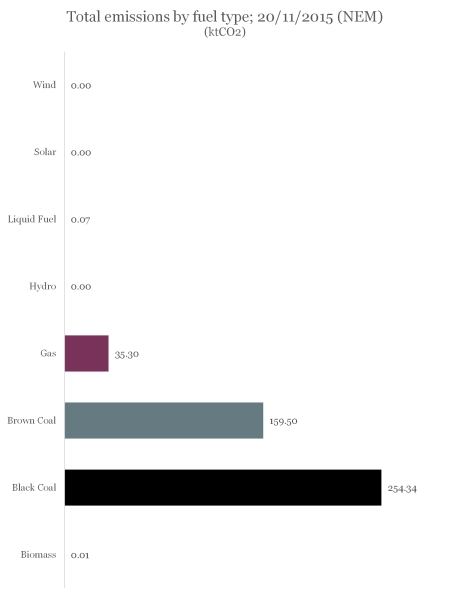
We estimate that the total quantity of carbon emissions over the course of the day was around 449 kilotonnes of CO2.
If renewable energy did not contribute, an extra 70 kilotonnes of CO2 would have been emitted. This illustrates the importance of us finding ways of meeting electricity demand using technology that doesn’t damage societies, economies and habitats.